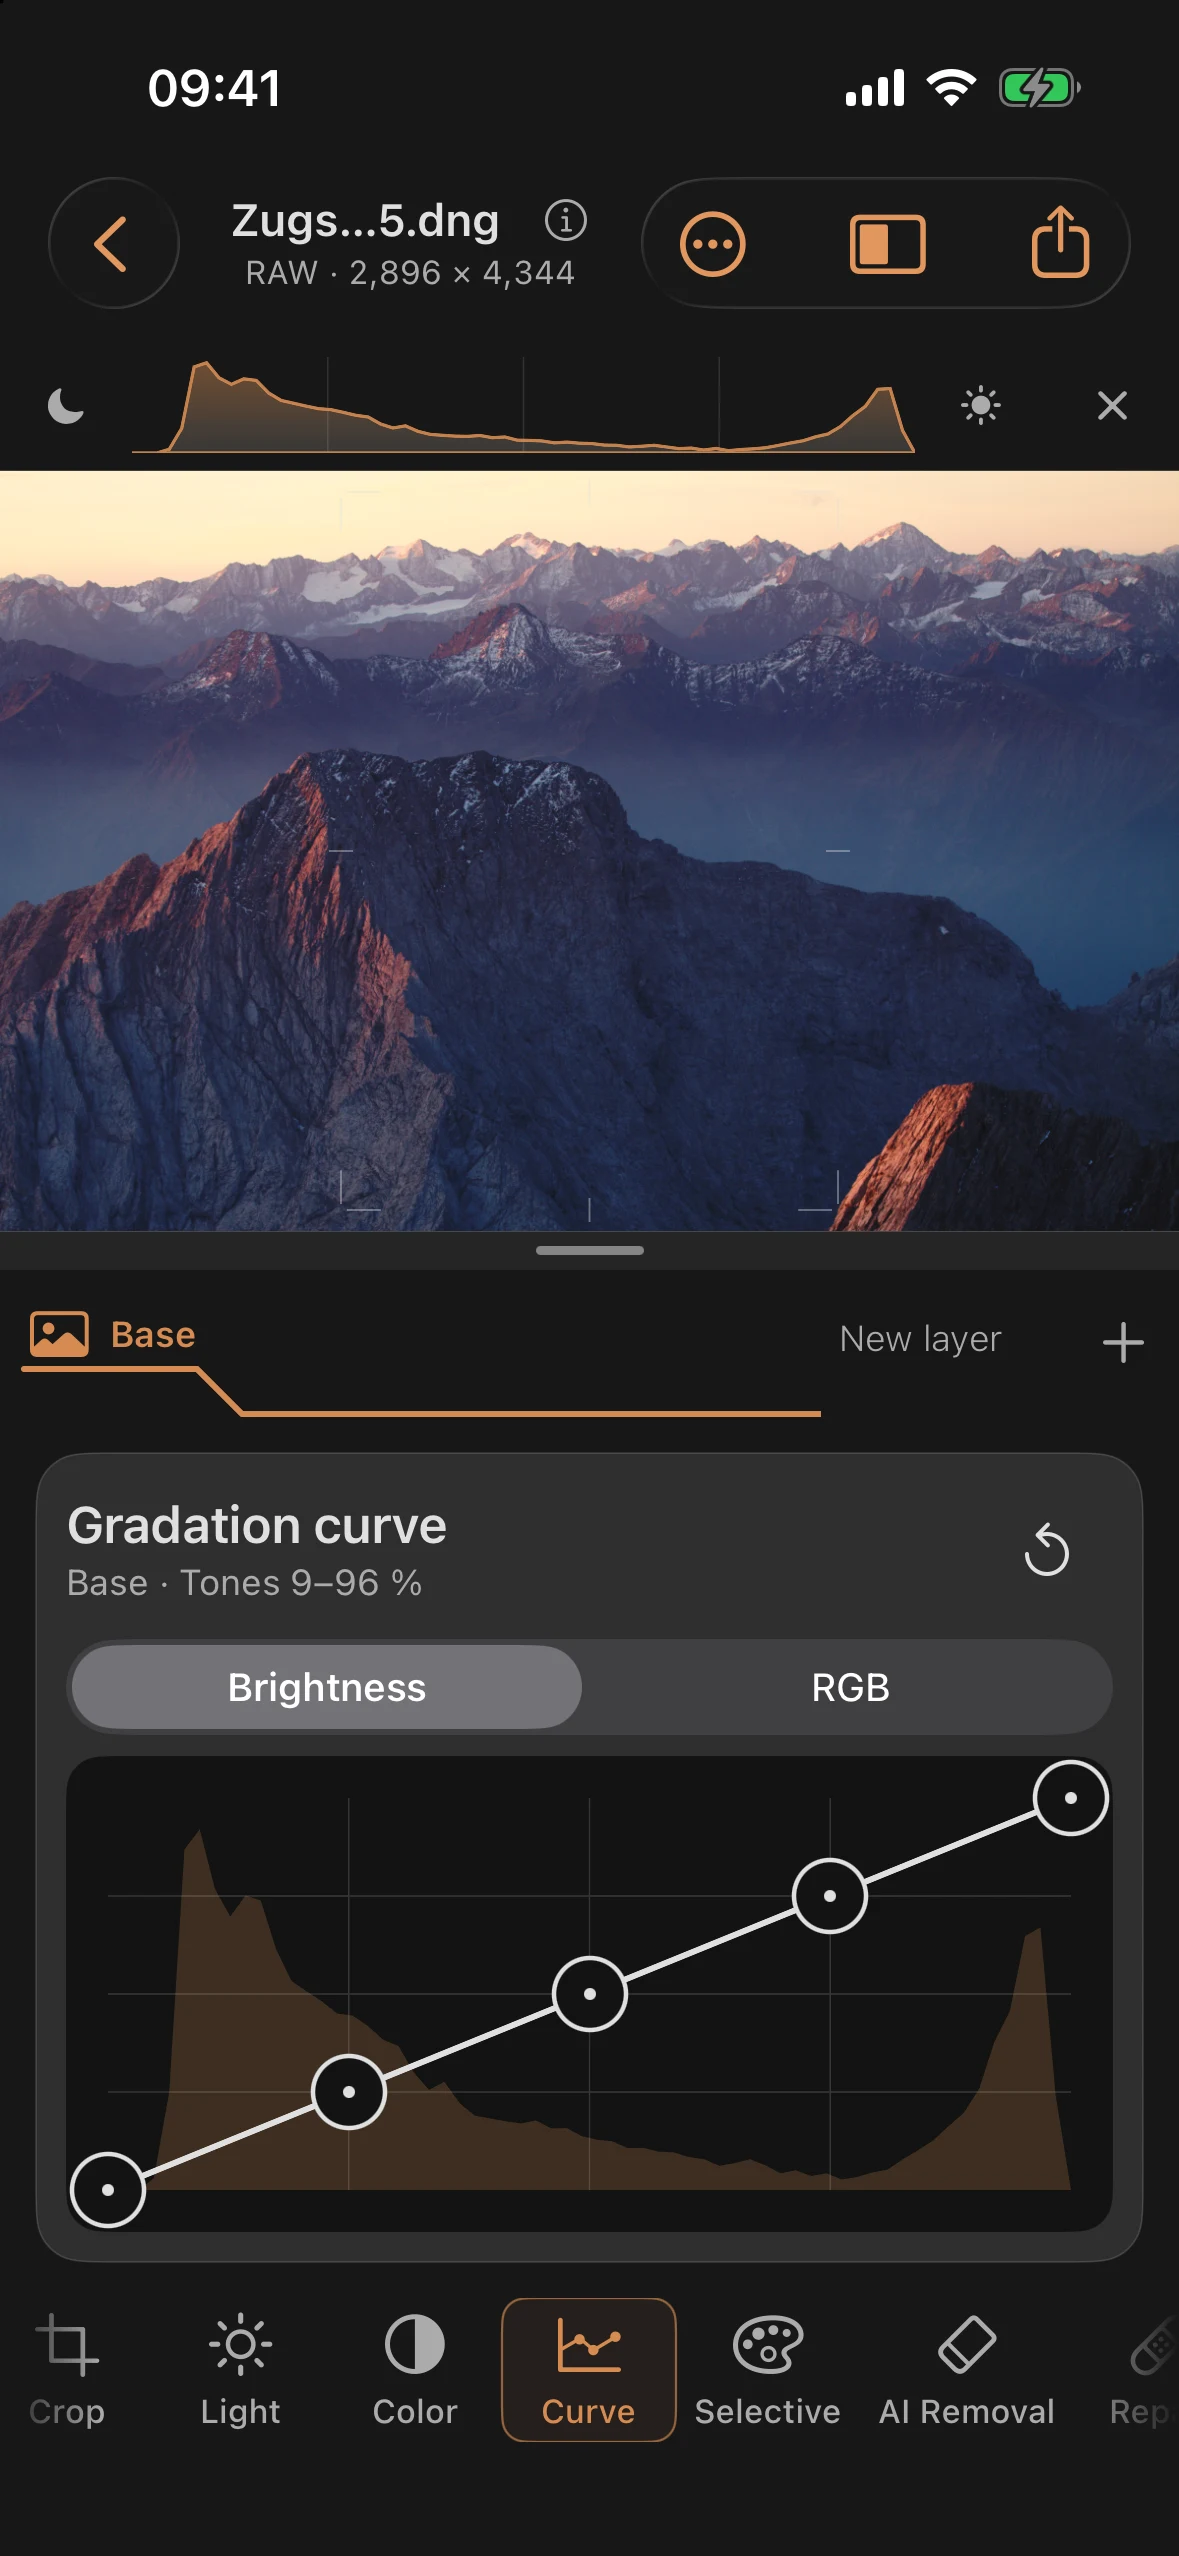
Curve: The Combined Tone Curve
The Curve tool shows the image’s “gradation curve” as a canvas with a histogram in the background and a dashed identity line. You move points on the curve to make specific tonal ranges brighter, darker, or more contrasty.
The displayed line matches the calculated curve. Each point changes only its two adjacent segments. Raising it increases their output; lowering it decreases their output. More distant tonal ranges stay unchanged. Ordinary rising curves have smooth joins. Deliberately flat or reversed segments can have a corner at the handle. Grabbing the edge of a point preserves its distance from your finger; a vertical drag changes only its output value.
Previously saved curves keep their original processing. Use Update curve processing to switch to the new calculation, then Undo to compare the result. Resetting the curve also selects the new calculation.
Brightness or RGB
Brightness is the default for new edits. The curve changes brightness while preserving color-channel ratios where the available gamut allows. Very bright, saturated colors lose chroma as needed to avoid harsh channel clipping.
RGB applies the same curve to red, green, and blue individually. It can change saturation and hue more strongly and remains available for creative looks. There are no separate per-channel curves.
Older documents retain their existing RGB curve. The selector applies to Base or the active mask. The curve follows light and color adjustments, with detail processing afterwards. The histogram shows the input to the curve.
The five fixed points
| Property | Range | Default |
|---|---|---|
| Curve points (X = input, Y = output) | 0 to 100 per axis | (0, 0) · (25, 25) · (50, 50) · (75, 75) · (100, 100) |
The curve works with exactly these five points — you can move them, but not add or remove any. The three interior points move horizontally (input tone) and vertically (output value). The two endpoints remain at input positions 0 and 100; their output values can be changed vertically.
No difference between RAW and JPEG/HEIF
The curve always runs over the full 0 to 100 range on each axis, regardless of image format.
Panel layout
- Heading “Gradation Curve.”
- A scope line shows the active layer and the histogram’s tonal range as a percentage, for example “Base · Tones 12–88%.”
- A “Reset” button brings all five points back onto the identity line.
Curve per mask
Like Light, Color, Selective, and Details, Curve is also available inside a mask — each mask carries its own, independent tone curve.
Accessibility
Through Adjustable actions (VoiceOver, keyboard control), you can move any curve point in 2% steps per action — for precise positioning without a touch gesture.
Practical tips
- A gentle S-curve — the shadow point nudged slightly down, the highlight point nudged slightly up — increases contrast without moving the white or black point.
- The scope line shows you which tonal range your image actually carries image information in (for example, “Tones 12–88%”) — points outside that range will move visibly little of the image, if anything.
- Chapter 3 of the tutorial series (“Gradation: From Soft to Hard”) shows how the same five points can reproduce both a soft and a hard gradation.
- Because the curve is independent per mask, you can, for example, set a flatter curve just in the sky while the rest of the image keeps its global curve.
Precise point readout
Selecting a curve point shows its input and output percentages in the tool header, for example 50 → 62. Opening Curve makes room for the plot. You can adjust the divider afterwards; the inspector scrolls when space is limited.